
How Close Is Your Colour to the Real Thing?
Lesson 5 of The Image as Data. Converting between colour spaces is exact arithmetic; deciding what the numbers mean physically is a fit. Checked against a colorimeter on 22 chart patches: treating the developed file as sRGB lands 9.54 ΔE*ab from the light in the room, the camera's own published matrix does no better, and a 3x3 fitted here and scored on patches it never saw reaches 2.41.
TL;DR — cvtColor is exact. What it assumes is not. Checked against a colorimeter
on 22 chart patches, treating the developed file as sRGB lands 9.54 ΔE*ab from the
light that was in the room. The camera’s own published characterisation does no better.
A 3 × 3 fitted on this scene and scored on eleven patches it never saw reaches
2.41 — and the gap between those numbers is the difference between choosing axes
and knowing what they mean.
Where we are
Part of The Image as Data. Lesson 4 laid out the coordinate systems and converted a real patch through all of them. Every one of those conversions is exact arithmetic. This lesson asks the question that arithmetic cannot answer: do the numbers describe the light that was actually there?
Everything above is arithmetic on the numbers in the file. None of it says whether those numbers describe the light that was in the room. The survey this unit measures on [3] lets us check: every metered patch carries a luminance and a CIE 1931 chromaticity, and luminance plus chromaticity is a full tristimulus value under the standard observer [2].
One decision has to be stated before any number means anything: CIELAB needs a reference white, and this scene is not lit by D65. The chart’s neutral row meters at , — tungsten, nowhere near D65’s (0.3127, 0.3290). So Lab is computed against the chart’s own white patch, on both sides of the comparison. Getting this wrong would report the lamp as a camera error.
Three routes from photosites to Lab, over the 22 patches that do not clip:
| route | what it knows about the camera | free parameters | ΔE*ab mean |
|---|---|---|---|
| treat the developed file as sRGB | nothing | 0 | 9.54 |
| Fairchild’s published D2x matrix | a characterisation of this camera | 1 (scale) | 9.14 – 10.29 |
| a 3 × 3 fitted here, scored on held-out patches | this scene | 9 | 2.41 |
What it means, one row at a time. The naive route is what most code does, and 9.54 ΔE is a long way off — for reference, 1.0 is roughly a just-noticeable difference. Its error is not spread evenly either. Down the neutral row it climbs monotonically from white to black:
| patch | 19 (white) | 20 | 21 | 22 | 23 | 24 (black) |
|---|---|---|---|---|---|---|
| ΔE*ab | 0.00 | 1.18 | 4.45 | 8.27 | 13.20 | 12.96 |
That is unit 1.2’s response curve seen from the colour side: the developed file is not proportional to light, and the discrepancy piles up in the shadows.
The middle row is the surprise, and it is worth being careful about. Fairchild’s own characterisation of this camera — a 3 × 3 he fitted to a ColorChecker and published [4] — does not beat the naive route here. It was applied four ways: his scene-fitted matrix and his D65-normalised one, each on raw and on white-balanced linear RGB. All four land between 9.14 and 10.29. One configuration going wrong would suggest a mistake on our side; four landing in the same place is a result.
The likely reason is that a 3 × 3 from camera RGB to XYZ is tied to the light it was characterised under, and this scene is tungsten. That is a belief, not a measurement — testing it needs the same camera under a second illuminant, and this scene cannot provide one.
The last row is the only honest prediction of the three. A 3 × 3 fitted on 11 patches and scored on the 11 it never saw reaches 2.41 ΔE mean, 2.01 median — four times better than the naive route, on patches that had no say in the fit. For comparison, Fairchild reports 2.5 mean for his matrix on its own 25 fitted patches, which is a residual rather than a prediction; ours is 1.49 on its training half, so the two numbers describe the same quality of fit.
The reading that matters: a large naive ΔE is a statement about the rendering
chain — the tone curve, the white balance, the assumption of sRGB primaries — and not
about cvtColor’s arithmetic, which is exact. Choosing axes is free. Knowing what the
axes mean in physical terms costs a calibration.
Now you try
Three channel gains and a tone exponent, against the 22 metered patches. Start from the naive route and try to bring the mean down.
You can reach about 4 with patience, which is most of the way — and then it stops. What is left needs the off-diagonal terms of a full 3 × 3, because the camera’s red channel sees some of what the eye calls green, and no amount of per-channel scaling expresses that.
In the wild
The lesson above needed a colorimeter. Here is a version of the same check that needs nothing but the subject, and you can run it on any photograph that happens to contain a colour chart.
A ColorChecker’s bottom row is neutral by manufacture. Whatever a camera reports for those six patches, the true answer for both colour axes is zero. So the departure from zero is the error, with no reference table to look up and nothing to take on trust.
Measured on a photograph of a chart, converting the file to Lab exactly as lesson 4 does:
| patch | 19 (white) | 20 | 21 | 22 | 23 | 24 (black) |
|---|---|---|---|---|---|---|
| L* | 88.0 | 81.3 | 69.3 | 50.7 | 29.0 | 4.4 |
| a* | 0.85 | 0.68 | 0.04 | 0.00 | −0.81 | −0.31 |
| b* | −2.93 | −3.30 | −1.67 | −0.19 | 0.02 | 0.66 |
| distance from neutral | 3.05 | 3.37 | 1.67 | 0.19 | 0.81 | 0.73 |
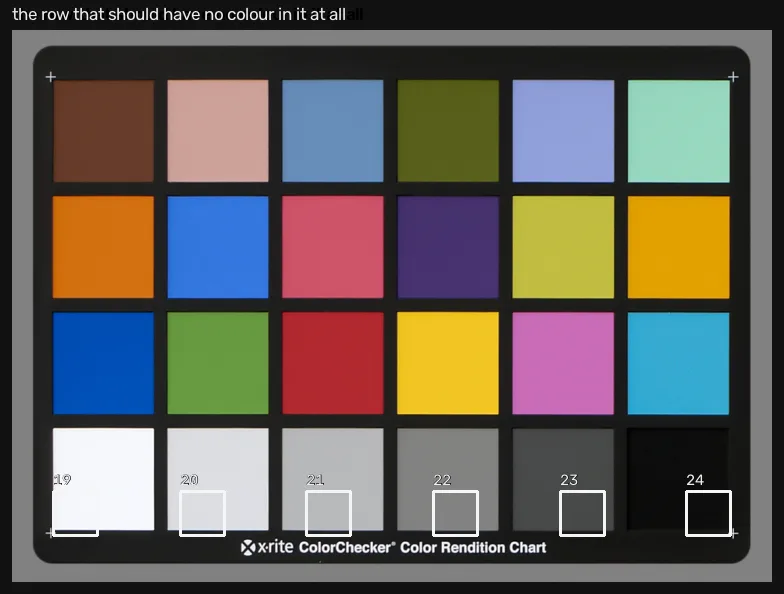
What it means: a mean of 1.64 and a worst of 3.37, where the correct answer is 0.00 and where 1.0 is roughly the smallest difference an eye can see. And the shape of the error is the informative part: it is the light patches that are off, both of them towards blue, while the dark ones sit almost exactly on neutral. A cast that grows with brightness is a white-balance error, not a random one — the photograph was developed for a whiter light than the one that was actually there.
This is the poor-relation version of the colorimeter comparison, and it is worth knowing precisely because it costs nothing. If a chart is in the frame, your pipeline can check its own colour with no ground truth beyond the fact that grey is grey.
Where this breaks
The fitted matrix is fitted to this scene, and would not transfer to daylight — which is the same criticism this lesson makes of the published one. Nine parameters on eleven training patches is also a generous ratio; the held-out score guards against memorising individual patches, but not against a systematic bias shared by all of them.
The mechanism behind the middle row is a belief, not a measurement. Testing it needs the same camera characterised under a second illuminant, and this scene has exactly one light in it.
ΔE*ab is the 1976 formula, chosen because it is what Fairchild’s characterisation reports and the comparison has to be like for like. It is known to overstate differences in saturated colours; CIEDE2000 would give smaller numbers for the same errors, and the ordering of the three routes would not change.
Finally, the patches are flat interiors under one lamp, which is the friendliest test available. Real scenes have mixed illuminants, and a single white point cannot serve two of them at once.
Next
File formats: what the encoder did — the last thing that happens to the array before you read it, and the first thing that happened to the one you loaded.
Further reading
- Colour science in depth: Reinhard et al., Color Imaging [1], for when a ΔE of 9.54 is not acceptable and you need to know what to do about it.
- The characterisation itself: Fairchild’s D2x notes [4] are two pages and publish both matrices along with their residuals.
- Related on CondadosAI: the camera response curve — why the naive route’s error grows into the shadows · colour spaces, the lesson this one checks.
References
[1] Reinhard, E., Khan, E. A., Akyüz, A. O., & Johnson, G. M. (2008). Color Imaging: Fundamentals and Applications. A K Peters/CRC Press.
[2] International Commission on Illumination (2004). CIE 15: Technical Report — Colorimetry (3rd ed.). The CIE 1931 observer and the CIELAB definition used here. CIE.
[3] Fairchild, M. D. (2007). The HDR Photographic Survey. Proceedings of the IS&T 15th Color and Imaging Conference, pp. 233–238. doi:10.2352/CIC.2007.15.1.art00044 — the scene this unit measures. Used for research and non-commercial publication, as its terms require; images are downloaded, never redistributed.
[4] Fairchild, M. D. (2007). Nikon D2x Characterization for HDR-from-NEF Images (updated 21 May 2007). Rochester Institute of Technology. Characterisation notes — the published RGB→XYZ matrices and their ΔE*ab residuals.