
Blog
Page 3 of 5
 Fundamentals
 The Image as Data: The Grid, the Integers, the Axes, and the File
The unit overview: what an array actually holds, where its samples sit, how finely each one is written down, what its three numbers mean, and what the encoder did before you read any of it. Measured on one photograph: two thirds of a colour image is interpolated, a 7.4-pixel ribbing returns as 96-pixel banding when you decimate by eight, bit depth stops buying anything at 9.4 bits, and the naive route from file to colour lands 9.54 ΔE from the light in the room.
 Fundamentals
 Fisheye Models: When Correcting the Lens Stops Working
Lesson 4 of the Image Formation unit. Past roughly 120 degrees the pinhole model is not inaccurate, it is the wrong shape, because tan θ runs to infinity while the sensor does not. Fitted to the same 15 photographs of one fisheye lens, pinhole plus Brown-Conrady reaches 7.326 px RMS and Kannala-Brandt reaches 0.644 px. At 80 degrees the first model predicts a radius of -35,572 px, a sign flip; the second predicts 458.8 px, which is on the sensor.
 Fundamentals
 Canny: Non-Maximum Suppression and Hysteresis, Taken Apart
Lesson 4 of the Edge Detection unit. Canny is two independent mechanisms, not one tuned number. NMS collapses a five-pixel ridge to one pixel by comparing along the gradient; hysteresis keeps a weak chain because it touches a strong seed. Worked on nine numbers: a single threshold gives either 1 pixel or 9, and hysteresis gives the 6 that belong to a real contour. Measured on a photo, that is 204 contours averaging 18.68 px against 393 averaging 9.69 px at the same pixel budget.
 Fundamentals
 Corners: The Structure Tensor, Harris, Shi-Tomasi and Förstner
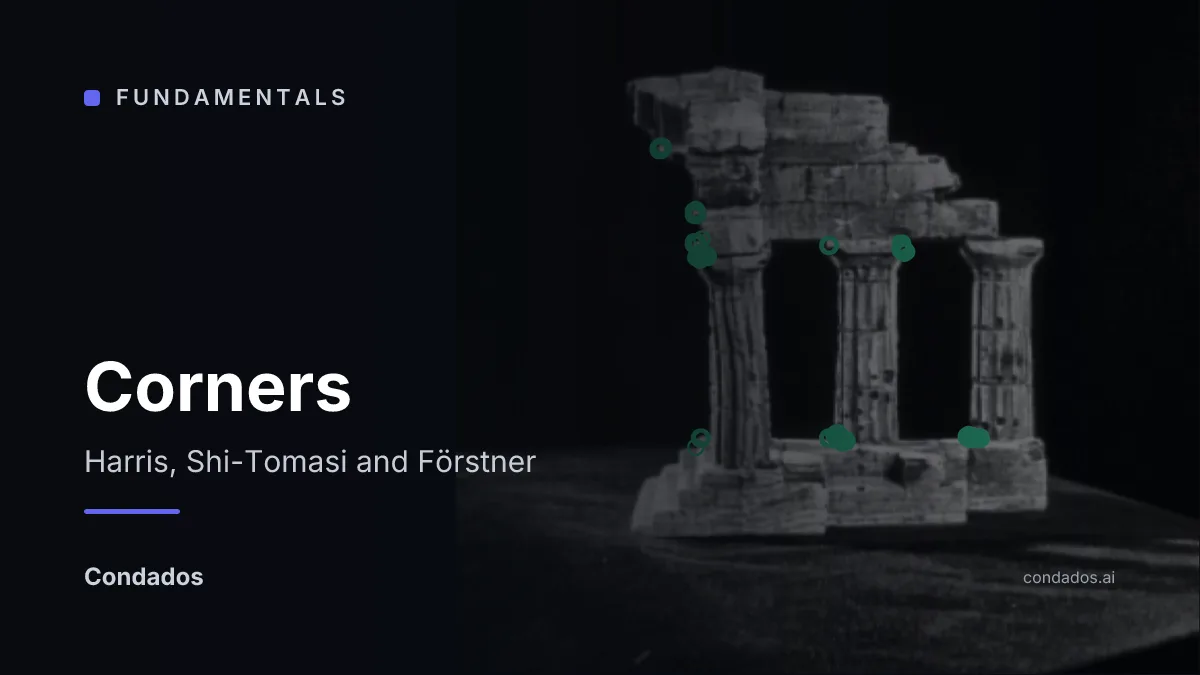
Lesson 5 of the Edge Detection unit. A contour says where a boundary runs but not where you are along it. Two eigenvalues of a 2x2 matrix fix that: measured on a real photo, flat background scores 0.001/0.000, an edge 0.411/0.019 and a corner 0.442/0.318. Harris, Shi-Tomasi and Förstner all read that same matrix, and on the edge patch Harris comes out positive at k = 0.04 and negative at k = 0.06, so k decides the answer rather than the data.
 Fundamentals
 Edge Detection: Finding Where One Thing Stops and Another Begins
The unit overview: what counts as an edge, the two derivatives that find one, why a single threshold never works, and how contours become the points a matcher can use. Measured on one photo: smoothing across rows recovers 80% of the clean edge set at noise σ=20 against 63% without it, and hysteresis returns contours twice as long as a single threshold at the same pixel budget.
 Fundamentals
 Image Gradients: Central Differences, Prewitt and Sobel
Lesson 2 of the Edge Detection unit. Three operators compute the same derivative and behave differently on a noisy photo. Worked by hand on a 3x3 patch: Sobel gives Gx = Gy = 1.80, a magnitude of 2.55 and an orientation of 45 degrees, while Prewitt gives 1.20 and 1.70 on identical pixels. Measured across a noise sweep, Prewitt beats Sobel at every level, and the reason is that its normalised weights have a smaller sum of squares.
 Fundamentals
 The Laplacian, LoG and Zero-Crossings
Lesson 3 of the Edge Detection unit. The second derivative crosses zero at an edge instead of peaking, which locates a step edge at exactly x = 3.5 from integer pixels. It also has no smoothing in it: nine pixels disturbed by 0.03 produce four sign changes where there should be one. Measured on a photo, noise multiplies the zero-crossing pixels by 2.76x at sigma = 1.0 and 1.02x at sigma = 3.0, and only 33% of the resulting contours are closed.
 Fundamentals
 What Is an Edge? Step, Ramp and Roof, and the Two Derivatives That Find Them
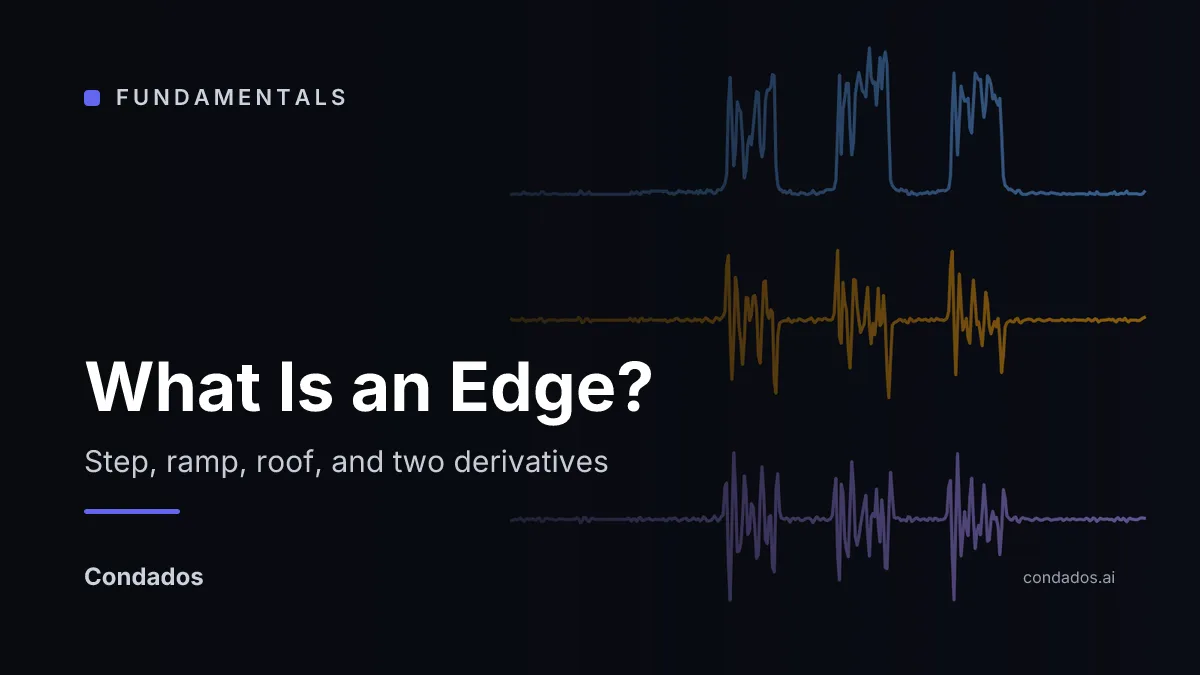
Lesson 1 of the Edge Detection unit. An edge is a peak in the first derivative and a sign change in the second. Worked by hand on nine pixels: the peak lands on column 4 and the second difference is exactly zero there. Add plus-or-minus 0.03 of noise and the first derivative holds its position while the zero-crossing slides half a pixel off the edge, which is why Canny is built on the first derivative and not the second.
 Fundamentals
 RANSAC: How Vision Algorithms Vote Away Outliers
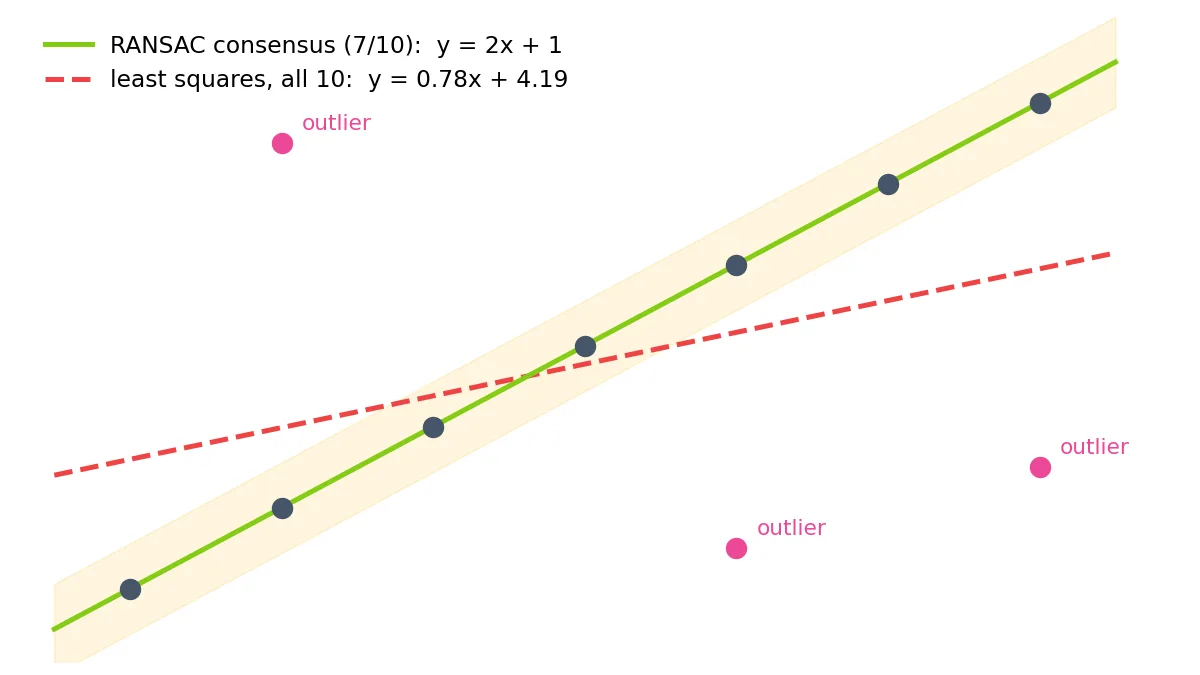
RANSAC separates data into inliers and outliers by fitting models to random minimal samples and keeping the one with the largest consensus. Walked end to end on two vision problems: a walking-speed estimate that three false detections drag from 2.00 m/s to 0.78, and a basketball shot called from a 3-point parabola fit. Plus the one-line formula for how many samples you need, a hands-on lab, and real inlier ratios measured on the temple dataset.